Creating your own risk functions
Before we start
This tutorial is aimed at new users who want to start creating their own risk functions to use in RiskScape. We expect that you:
Have completed the How to build RiskScape models guide and are familiar with building and running a RiskScape model.
Have completed the RiskScape projects and bookmarks and know how to edit the
project.inifile.Have a basic understanding of risk analysis concepts, such as damage curves.
Have some basic Python knowledge, or a willingness to learn.
The aim of this tutorial is to get you familiar with creating functions in RiskScape, so that you can build models on your own.
Setup
Click here to download the example project we will use in this guide.
Unzip the file into the Top-level Windows project directory where you keep your RiskScape projects.
For example, if your top-level projects directory is C:\RiskScape_Projects\,
then your unzipped directory will be C:\RiskScape_Projects\functions-tutorial.
Open a command prompt and cd to the directory where you unzipped the files, e.g.
cd functions-tutorial
You will use this command prompt to run the RiskScape commands in this tutorial.
The unzipped project contains a few sub-directories:
functions-tutorial\datacontains the input data files we will use in this tutorial. This data is similar to the Upolu tsunami data that we used in the previous tutorials.functions-tutorial\functionscontains files we will use to create new RiskScape functions.functions-tutorial\modelscontains some pre-built models we will use to test our functions as we go along.
Note
This input data was provided by Earth Sciences New Zealand, as well as the PCRAFI (Pacific Risk Information System) website. The data files have been adapted slightly for this tutorial.
There is also an initial functions-tutorial\project.ini file that we will modify.
Open this project.ini file in Notepad (or your preferred text editor).
Background
Functions are typically used in the Consequence Analysis phase of the model workflow, to determine the impact or consequence that the hazard has on each element-at-risk.
You may recall the following points from earlier tutorials:
In general, RiskScape will call your function for each element-at-risk (i.e. building) in your exposure-layer. If your data contains 6,000 buildings, then your function will get called 6,000 times.
RiskScape will pass your function two values: the element-at-risk (i.e. the building) and the hazard intensity measure (i.e. the tsunami inundation depth). We call these the function’s arguments.
The function’s return value gets added to the model’s results as the
consequenceattribute.
Varieties of risk function
Some common varieties of functions that you might want to use in a RiskScape model include:
Exposure functions: these determine whether or not a building was exposed to the hazard. These functions simply return a binary true (i.e.
1) or false (i.e.0) result.Fragility functions: these determine the likelihood that a given building was damaged. These functions return a probability between zero and one. For example, at a tsunami depth of 0.5m the probability of any building damage might be 0.36, meaning that on average 36% of buildings would sustain some damage if exposed to that tsunami depth.
Vulnerability functions: these quantify the likely damage to the building. These functions return a damage ratio (DR) representing the likely cost to repair the building, based on the building’s value. For example, a DR of zero would indicate an undamaged building, whereas a DR of 1.0 would indicate that the building would need to be completely replaced.
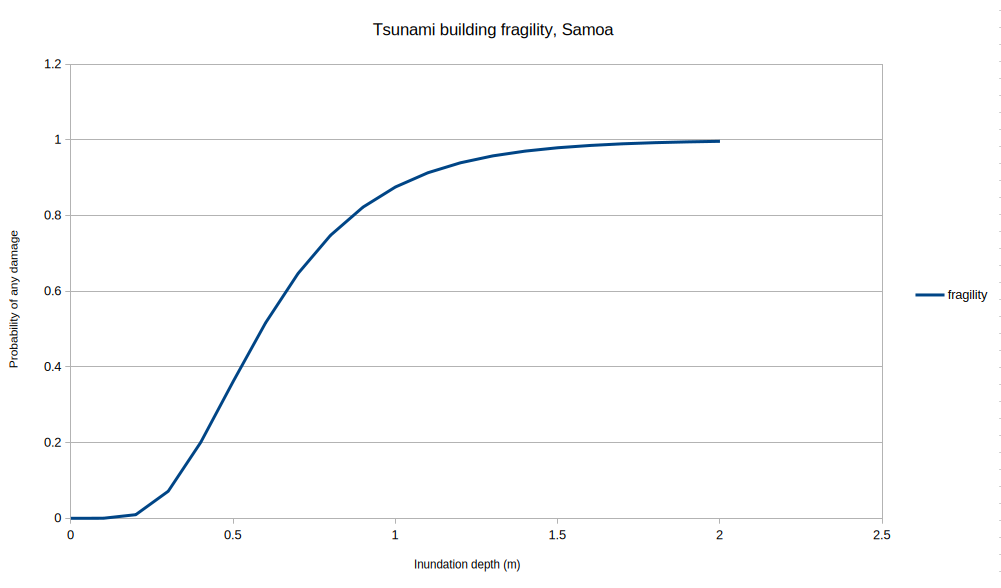
Often a fragility or vulnerability function can be represented by a curve - as the hazard intensity increases, so does the likelihood or degree of damage. For example, we will define a fragility function later that looks like this:
RiskScape function frameworks
The RiskScape engine supports several different function “frameworks”, which are different ways that you can define your own function. The different frameworks have different trade-offs between simplicity, flexibility, and speed. RiskScape’s function frameworks include:
CSV framework: A vulnerability or fragility curve is simply defined in a CSV file as a series of data-points, consisting of hazard intensity and the corresponding damage ratio or fragility. This framework offers an easy way to define a simple vulnerability or fragility curve.
Jython framework: RiskScape’s built-in Python support, which uses a Java-based Python implementation called Jython. Good for simple functions, but Jython is a little different to “regular” Python, and so doesn’t support the full range of Python libraries, like
numpyandscipy.CPython framework: This uses the Python installed on your computer. Any Python examples on the internet should be compatible with this framework, but it requires an extra one-off setup step to configure RiskScape.
Expression framework: Uses RiskScape’s built-in RiskScape expression language. RiskScape expressions are a little advanced, but can be handy for simple things, like the equivalent of a spreadsheet formula.
The rest of the tutorial will walk-through implementing some simple risk functions using some of the above frameworks.
Tip
If you are new to Python, or find the idea of RiskScape functions a little intimidating, then there is a simple RiskScape Hello, world exercise you could try first.
A simple threshold function
The project you downloaded contains a exposure-by-region model, which uses the built-in is_exposed function.
This function returns 1 if the element-at-risk was exposed to any hazard data, and 0 if not.
Even if a building was exposed to 1cm of inundation, it would still count as exposed.
Let’s try adding our own version of this function that applies a minimum threshold of 0.1m to the hazard intensity value.
Add the following to your project.ini file and save it.
[function exceeds_threshold]
description = Returns 1 if the inundation depth exceeds a 10cm threshold, 0 otherwise
framework = expression
source = '''
   (building, hazard) -> if(hazard > 0.1, then: 1, else: 0)
'''
Warning
This function is purely for demonstrative purposes and is not based on scientific methodology in any way.
Now try using this new function in your model by running the following command:
riskscape model run exposure-by-region -p "analysis.function=exceeds_threshold"
It should produce a event-impact.csv file containing the following results.
Region,Exposed_buildings
Aleipata Itupa i Lalo,503
Aleipata Itupa i Luga,323
Falealili,704
Lepa,264
Lotofaga,138
If you look closely, you will see the Exposed_buildings count is now lower,
as buildings that were exposed to <= 10cm of tsunami inundation are now excluded from the results.
Tip
Using a threshold function like this might be useful for dealing with hazard data such as rainfall, wind-speed, or Peak Ground Acceleration (PGA). For example, a given element-at-risk might be exposed to hazard data, but the hazard intensity might be too small to cause any real damage.
The INI function definition
Let’s look at the INI definition again in a bit more detail.
[function exceeds_threshold]
description = Returns 1 if the inundation depth exceeds a 10cm threshold, 0 otherwise
framework = expression
source = '''
   (building, hazard) -> if(hazard > 0.1, then: 1, else: 0)
'''
The first [function exceeds_threshold] line tells RiskScape that you are
defining a function, and its name is exceeds_threshold.
Tip
We recommend using underscores (_) rather than hyphens (-) in your function names.
The description is optional, and is purely there to help you keep track of your functions.
Every RiskScape function must define either a source or a location,
which defines what the function does (i.e. the source code).
When using source, the code is simply defined inline in the INI file (like in our example),
whereas with location the code is defined separately in another file.
Note
You can use ''' to mark the start and end of a INI file definition that spans multiple lines.
For defining simple functions, this is a handy way to include the source code inline.
This threshold function uses the expression function framework,
which means the function’s code is defined in the RiskScape expression language.
In this case, the expression simply uses RiskScape’s built-in if() function,
which behaves a lot like the IF() formula in a spreadsheet.
Tip
You can use the riskscape function list command to check your function has been
defined correctly. Your new function should now appear in the output,
and without any errors displayed alongside it.
The other things you may need to define for a function are its argument-types and return-type.
In this case, because we are using the expression framework, these are optional and
RiskScape can infer them for us.
The first part of the expression (i.e. (building, hazard) ->) tells RiskScape to expect
two function arguments - the building data and the hazard intensity measure.
CSV-based functions
Now let’s look at defining some fragility functions using the CSV function framework, based on the research paper Evaluating building exposure and economic loss changes after the 2009 South Pacific Tsunami.
This research used a fragility curve to determine the probability of damage to a building, based on a given tsunami hazard intensity measure. Five different damage states (DS) were used, from light non-structural damage (DS1), through to complete structural collapse (DS5).
Note
These fragility functions were originally provided by Earth Sciences New Zealand and have been reworked and adapted for this tutorial.
A simple fragility function
Let’s look at the DS1 damage state to start with.
Open the functions/DS_1-fragility-curve.csv file in your spreadsheet application.
It simply contains a series of hazard values (depth, in metres) and the corresponding fragility at that depth
(i.e. the probability of any damage), like this:
hazard |
fragility |
|---|---|
0.0 |
0.0 |
0.1 |
0.00006 |
0.2 |
0.00947 |
0.3 |
0.07144 |
0.4 |
0.20052 |
0.5 |
0.36142 |
0.6 |
0.51662 |
0.7 |
0.64684 |
0.8 |
0.74764 |
… |
… |
The RiskScape CSV function framework will use linear interpolation to fill in the gaps between the data-points. For example, for a 0.75m hazard depth, then a fragility of 0.69724 would be returned (halfway between the data-points of 0.64684 at 0.7m and 0.74764 at 0.8m).
Tip
You can plot this data to better visualize what the curve looks like. This was the plot we showed earlier.
Now add the following to your project.ini file and save it.
[function Building_Fragility]
description = Returns the probability of any building damage, based on the DS1 curve
location = functions/DS_1-fragility-curve.csv
Now test the new fragility function by running the following command:
riskscape model run damage-by-region -p "analysis.function=Building_Fragility"
This is similar to the damage-by-region model we used previously, except instead of counting
the exposed buildings, we sum the individual building fragility values to determine the approximate number of damaged buildings.
For example, if 100 buildings were exposed to 0.5m of inundation, and that has a 0.36 probability of damage,
then we would expect approximately 36 of the 100 buildings to be damaged, on average.
The model should produce a event-impact.csv file containing the following results:
Region,Damaged_buildings
Aleipata Itupa i Lalo,455
Aleipata Itupa i Luga,280
Falealili,583
Lepa,247
Lotofaga,111
Building-specific fragility
Using the exact same fragility curve for all buildings is a very simple example. Often the fragility of a given building will be dependent on the building’s characteristics, such as the building’s construction material or age.
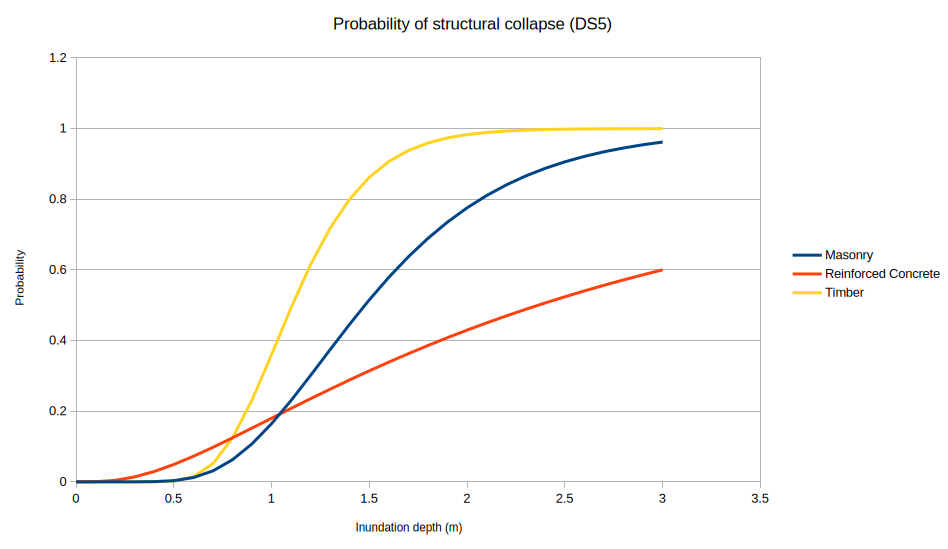
Let’s now look at the DS5 damage state, which is the probability of structural collapse
and is dependent on the building’s construction framing.
Our exposure-layer input data contains a Cons_Frame text-string attribute containing one of the following text-string values: Masonry, Steel, Reinforced Concrete, or Timber.
Open the functions/DS_5-fragility-curve.csv file in your spreadsheet application - this time
instead of a single ‘fragility’ column you should see separate columns for Masonry, Steel, Reinforced Concrete, and Timber.
Each column represents a separate fragility curve for that building material,
and correspond to the Cons_Frame attribute’s values in the exposure-layer input data.
Plotted as graph, the CSV data looks like this:
Now add the following to your project.ini file and save it.
[function Probability_of_Collapse]
description = Returns the probability of building collapse, based on the DS5 curve
location = functions/DS_5-fragility-curve.csv
exposure-attribute = Cons_Frame
default-exposure-value = Timber
This is similar to the previous function, except we have two new lines:
exposure-attribute = Cons_Frame
default-exposure-value = Timber
The exposure-attribute specifies the attribute in the exposure-layer that will be matched against the CSV column headings.
In this case, the Cons_Frame attribute will be used.
For example, if the Cons_Frame attribute for a building contains the value ‘Masonry’,
then the Masonry column in the CSV file will be used for that building.
The default-exposure-value specifies the column to use by default (Timber in this case),
if no column matched the building’s Cons_Frame value at all.
For example, this could happen if the Cons_Frame value for a given building is unknown or not set.
Now test the new fragility function by running the following command:
riskscape model run damage-by-region -p "analysis.function=Probability_of_Collapse"
It should produce a event-impact.csv file containing the following results:
Region,Damaged_buildings
Aleipata Itupa i Lalo,375
Aleipata Itupa i Luga,260
Falealili,440
Lepa,235
Lotofaga,90
The damaged building count is lower compared to the previous Building_Fragility function because
the probability of structural collapse is lower compared to the probability of any damage.
Extending CSV functions
You can specify an optional map-value expression for CSV functions,
which lets you apply an additional transformation to the return-value derived from the CSV file data.
The typical use-case would be that the CSV file contains a damage ratio (DR) curve,
and map-value would let you convert the DR into a loss, like this:
# turn a damage ratio into a loss based on the building's value
map-value = DR -> DR * building.Replacement_Cost
In our example, we are working with fragility instead of a DR, but we can still apply
a transformation to the data. Add the following to your project.ini file and save it.
[function Building_Collapse]
description = Returns 1 for a building collapse, based on the DS5 curve and random number generation
location = functions/DS_5-fragility-curve.csv
exposure-attribute = Cons_Frame
default-exposure-value = Timber
# 'roll the dice' to see if building has collapsed
# To do this, we pick a random number and seeing if it's less than the fragility
map-value = fragility -> if(random_uniform(0, 1) <= fragility, 1, 0)
This is essentially the same as the previous Probability_of_Collapse function, except that
the new map-value line adds a Bernoulli trial
to the function.
Instead of returning the probability of collapse (i.e. a number between one and zero),
this function now uses random number generation to ‘roll the dice’ and determine whether
or not a given building has collapsed (i.e. returning either one, if collapsed, or zero otherwise).
Test the new function by running the following command:
riskscape model run damage-by-region -p "analysis.function=Building_Collapse"
Run this command repeatedly a few times and look at the event-impact.csv files produced.
The numbers should be in a similar ballpark to using the Probability_of_Collapse function,
except that now the numbers will be slightly different every time the model is run,
due to the randomness of the Bernoulli trial.
Returning multiple damage states
So far we have looked at using a single fragility curve for all buildings, and picking the appropriate fragility curve based on a building attribute (i.e. construction framing). However, you may start to hit limitations if you try to use the CSV function framework for more complicated scenarios.
The main limitation are:
The exposure-layer attribute needs to fit into clear categories, i.e. it doesn’t work well with continuous data, like floor area or year of construction.
You can only pick one exposure-layer attribute to use, i.e. you can’t pick a fragility curve based on construction material and year of construction.
If you’re picking a curve based on an exposure-layer attribute, you can only return a single value, i.e. you can only return a single damage state, instead of DS1 through DS5.
You can work-around a lot of these limitations with clever use of bookmarks and expression functions. For example, you could assign each building to a ‘bin’ or ‘bucket’ based on floor area. Or, you could combine multiple curves with an expression function like this:
[function Damage_State]
description = Returns both DS1 and DS5 probabilities for a building
framework = expression
source = '''
(building, hazard) -> {
    DS_1: Building_Fragility(building, hazard),
    DS_5: Probability_of_Collapse(building, hazard)
}
'''
However, for more complex fragility and vulnerability functions it may be easier to just use Python.
Python functions
We will now take the example risk functions we have been working with and show you how to define the same thing in Python. These examples will actually use the Jython framework, so that you do not need to have CPython installed and configured.
A simple threshold function
Add the following to your project.ini file and save it.
[function exceeds_threshold_Python]
framework = jython
description = Returns 1 if the inundation depth exceeds a 10cm threshold, 0 otherwise
source = '''
THRESHOLD = 0.1 # metres

def function(building, hazard):
    if hazard is None or hazard <= THRESHOLD:
        return 0
    else:
        return 1
'''
argument-types = [building: anything, hazard: nullable(floating)]
return-type = floating
The function code is still defined using source ‘inline’ in the INI file,
however, this time Python code is used.
Note
The main entry point to a RiskScape Python function must
always be defined as def function.
Now try using this new function in your model by running the following command:
riskscape model run exposure-by-region -p "analysis.function=exceeds_threshold_Python"
The event-impact.csv file produced should contain the same numbers as
the exposure-by-region model results from earlier, when you used the
expression framework function.
Types
RiskScape is a strongly typed language, which means each attribute in the model input data has a type associated with it, such as floating-point number or text-string.
In our previous examples, the function frameworks automatically worked out the type of the function’s arguments and return-type for us. However, with Python functions we have to tell RiskScape about the function’s types explicitly. We do this using the following lines in our INI function definition:
argument-types = [building: anything, hazard: nullable(floating)]
return-type = floating
The building argument type here is anything, which means we can pass any sort of exposure-layer data to our function.
The hazard argument here is nullable, which means a hazard intensity measure might not exist for every element-at-risk.
For example, if a building falls outside the hazard bounds, then there will be no hazard intensity measure associated with it.
In these cases our function will still be called, but the hazard argument will be nothing (None in Python).
Tip
Using the anything type as a function argument can be a little inefficient for performance,
but it is a simple way to get started defining your own RiskScape functions.
If your hazard-layer is shapefile data, then you could use the anything type for it too, e.g. hazard: nullable(anything).
A simple fragility function
Let’s now recreate the DS1 fragility curve in Python.
Instead of defining the fragility curve in a CSV file, this time we will use a
log-normal Cumulative Distribution Function (CDF)
to determine the probability (between 0 and 1.0) of a building being in damage state 1.
Effectively this is the same curve as in our DS_1-fragility-curve.csv file - a
log-normal CDF curve is just another way of representing the same information.
Add the following to your project.ini file and save it.
[function Building_Fragility_Python]
framework = jython
description = Returns the probability of any building damage, based on the DS1 curve
source = '''
def function(building, hazard_depth):
    if hazard_depth is not None and hazard_depth > 0:
        return log_normal_cdf(hazard_depth, mean=-0.53, stddev=0.46)
    else:
        return 0.0

def log_normal_cdf(x, mean, stddev):
    # this is the Jython-equivalent of the following CPython code:
    #   scipy.stats.lognorm(s=stddev, scale=math.exp(mean)).cdf(x)
    # but it uses the built-in RiskScape 'lognorm_cdf' function instead of scipy
    return functions.get('lognorm_cdf').call(x, mean, stddev)
'''
argument-types = [building: anything, hazard: nullable(floating)]
return-type = floating
This Python code actually contains two Python def functions.
RiskScape will try to always use the def function Python code as the ‘entry-point’.
To calculate the log-normal CDF in a CPython function, you would typically use the
SciPy log-normal
distribution. Because we are using Jython here, we use a built-in RiskScape function (lognorm_cdf) instead.
Tip
One difference between Jython vs CPython is that Jython cannot use common Python packages, like scipy.
We are only using Jython here so that you do not have to have CPython
installed and configured to run these examples.
Most Python examples on the internet relate to CPython, so you will likely
find it easier to use the CPython framework.
Now enter the following command to run a model using your new function:
riskscape model run damage-by-region -p "analysis.function=Building_Fragility_Python"
Take a look at the event-impact.csv file produced - the results should be the
same as using your DS1 CSV function earlier.
Exposure-layer attributes
So far these Python examples have only used the hazard intensity value and haven’t needed to access any of the exposure-layer information.
The exposure-layer data gets passed to the function as a Python dictionary.
If our function argument is called building, then can access attributes from the exposure-layer using:
value = building['ATTRIBUTE_NAME']
Replace ATTRIBUTE_NAME with whatever exposure-layer attribute you are interested in, e.g. Use_Cat, Cons_Frame, etc.
Remember that you can use the riskscape bookmark info command to see what attributes are present in your exposure-layer.
Note
You can also access the exposure-layer attributes by using building.get('ATTRIBUTE_NAME').
The difference is this approach will return None if the attribute doesn’t exist in the exposure-layer,
whereas building['ATTRIBUTE_NAME'] will result in a Python KeyError exception and your model will stop.
Building-specific fragility
Now let’s look at recreating the DS5 fragility curve in Python,
which is dependent on the building’s construction framing.
There is a functions/DS5_fragility.py file in your project directory
that contains the following Python code:
def function(building, hazard_depth):
    construction = building['Cons_Frame']

    if hazard_depth is None or hazard_depth <= 0:
        return 0.0
    elif construction in ['Masonry', 'Steel']:
        return log_normal_cdf(hazard_depth, mean=0.39, stddev=0.4)
    elif construction in ['Reinforced_Concrete', 'Reinforced Concrete']:
        return log_normal_cdf(hazard_depth, mean=0.86, stddev=0.94)
    else: # 'Timber' or unknown
        return log_normal_cdf(hazard_depth, mean=0.1, stddev=0.28)

def log_normal_cdf(x, mean, stddev):
    # this is the Jython-equivalent of the following CPython code:
    #   scipy.stats.lognorm(s=stddev, scale=math.exp(mean)).cdf(x)
    # but it uses the built-in RiskScape 'lognorm_cdf' function instead of scipy
    return functions.get('lognorm_cdf').call(x, mean, stddev)
This Python code uses the building’s Cons_Frame attribute to determine which fragility curve to use.
Using different mean and standard deviation values will change the shape of the log-normal CDF curve,
which reflects differences in how the various construction types respond to tsunami inundation.
Add the following to your project.ini file and save it.
[function Probability_of_Collapse_Python]
framework = jython
description = Returns the probability of building collapse, based on the DS5 curve
location = functions/DS5_fragility.py
argument-types = [building: anything, hazard: nullable(floating)]
return-type = floating
Note
Instead of using source, this time our function definition uses location
to specify the location of a .py file containing the Python code.
Now try using this new function in your model by running the following command:
riskscape model run damage-by-region -p "analysis.function=Probability_of_Collapse_Python"
Take a look at the event-impact.csv file produced - the results should be similar
to using your Probability_of_Collapse CSV function earlier.
Errors in your Python code
Let’s look at what happens when something goes wrong with our Python code.
There is a functions/bad.py file in your project directory that contains the
following Python code:
def function(building, hazard):
    construction = building['Construction']

    if hazard is None or hazard <= 0 or construction != 'timber':
        return 0
    else:
        return 1
Add the following to your project.ini file and save it.
[function exposed_timber_buildings]
description = A simple exposure function containing mistake(s)
location = functions/bad.py
argument-types = [building: anything, hazard: nullable(floating)]
return-type = floating
Now try using this new function in your model by running the following command:
riskscape model run exposure-by-region -p "analysis.function=exposed_timber_buildings"
It should produce the following error:
Execution of your data processing pipeline failed. The reasons for this follow:
  - Failed to evaluate `map(hazard, hv -> exposed_timber_buildings(exposure, hv))`
    - Failed to evaluate `exposed_timber_buildings(exposure, hv)`
      - A problem occurred while executing the function 'exposed_timber_buildings'.
        Please check your Python code carefully for the likely cause.
        - KeyError: Construction - File "file:///C:/RiskScape_Projects/project-tutorial/functions/bad.py", line 2
This message tells us the details of the Python exception that occurred
(KeyError for Construction) and the line number in the Python file that triggered the problem. Line 2 in the bad.py file is the following:
construction = building['Construction']
Remember that building is a Python dictionary that represents the exposure-layer data.
A KeyError occurs in Python if the key (i.e. Construction) doesn’t exist in the Python dictionary.
This would mean that the Construction attribute doesn’t exist in the exposure-layer.
You may recall from earlier examples that the exposure-layer attribute is actually called Cons_Frame.
Note
Because we used building: anything here in this function’s definition,
RiskScape does not check the attributes present in the building data at all.
Using building: anything is like a wildcard, which means that it’s the Python
code’s responsibility to check that the function argument data it is given is correct.
This function is just an example of what function errors look like in RiskScape.
You don’t have to fix up the bad.py Python code unless you want to.
Tip
You can fix this sort of problem by either changing the function to match the input data,
or changing the input data to match the function.
You could do the latter by using set-attribute.Construction = Cons_Frame in
a RiskScape bookmark to rename the Cons_Frame attribute to what the function expects.
Type definitions
Up until now, these example Python functions have been returning a single floating-point value. In our INI file function definition it has looked like this:
return-value = floating
To return multiple attributes, our Python code simply needs to return a Python dictionary.
However, we have to make sure the return-type in our INI file function definition matches
the return value in our Python code.
In RiskScape, a set of related attributes is called a Struct. A struct is conceptually similar to a Python dictionary. Each attribute in a struct has a name and a type.
If we wanted our risk function to return five damage state probabilities,
then our Python code might return dictionary containing keys DS_1, DS_2, DS_3, DS_4, and DS_5.
Our INI file function definition would then need a return-type like this:
return-value = struct(DS_1: floating, DS_2: floating, DS_3: floating, DS_4: floating, DS_5: floating)
The five values are all probabilities (i.e. they are all floating-point numbers between zero and one),
and so they all have the type floating.
Tip
To see what built-in types are supported by RiskScape (i.e. floating, integer, text, etc),
you can use the riskscape type-registry list command.
For convenience, you can also define types separately in your INI file.
So alternatively, we could define a Damage_State struct with the same five attributes like this:
[type Damage_State]
type.DS_1 = floating
type.DS_2 = floating
type.DS_3 = floating
type.DS_4 = floating
type.DS_5 = floating
And then in our INI file function definition, we could simply use:
return-value = Damage_State
Returning multiple damage states
Now let’s look at a Python example that returns all five damage state probabilities.
Your project contains a functions/Samoa_Building_Fragility.py file that contains the
following Python code:
def function(building, hazard_depth):
    result = { 'DS_1': 0.0, 'DS_2': 0.0, 'DS_3': 0.0, 'DS_4': 0.0, 'DS_5': 0.0 }
    construction = building["Cons_Frame"]

    if hazard_depth is None or hazard_depth <= 0:
        return result

    result['DS_1'] = log_normal_cdf(hazard_depth, -0.53, 0.46)

    if construction in ['Masonry', 'Steel']:
        result['DS_2'] = log_normal_cdf(hazard_depth, -0.33, 0.4)
        result['DS_3'] = log_normal_cdf(hazard_depth, 0.1, 0.35)
        result['DS_4'] = log_normal_cdf(hazard_depth, 0.26, 0.41)
        result['DS_5'] = log_normal_cdf(hazard_depth, 0.39, 0.4)
    elif construction in ['Reinforced_Concrete', 'Reinforced Concrete']:
        result['DS_2'] = log_normal_cdf(hazard_depth, -0.33, 0.4)
        result['DS_3'] = log_normal_cdf(hazard_depth, 0.13, 0.56)
        result['DS_4'] = log_normal_cdf(hazard_depth, 0.53, 0.54)
        result['DS_5'] = log_normal_cdf(hazard_depth, 0.86, 0.94)
    else: # 'Timber' or unknown
        result['DS_2'] = log_normal_cdf(hazard_depth, -0.33, 0.4)
        result['DS_3'] = log_normal_cdf(hazard_depth, 0.06, 0.38)
        result['DS_4'] = log_normal_cdf(hazard_depth, 0.1, 0.4)
        result['DS_5'] = log_normal_cdf(hazard_depth, 0.1, 0.28)

    return result

def log_normal_cdf(x, mean, stddev):
    # this uses the built-in RiskScape 'lognorm_cdf' function
    return functions.get('lognorm_cdf').call(x, mean, stddev)
Add the following to your project.ini file and save it.
[function Damage_State_Python]
description = Returns DS1 through to DS5 probabilities for a building
location = functions/Samoa_Building_Fragility.py
argument-types = [building: struct(Cons_Frame: text), hazard: nullable(floating)]
return-type = Damage_State
framework = jython
Note
The return-type uses the Damage_State type definition from the previous example.
This is defined in the functions/types.ini file.
Instead of anything, the building function argument now also uses a struct type,
which specifies the Cons_Frame exposure-layer attribute that the Python code relies on.
Try running the model with the following command:
riskscape model run damage-by-region -p "analysis.function=Damage_State_Python"
This should produce an event-impact.csv results file containing the approximate number of buildings in
each damage state or higher. For example, the Damaged_buildings.DS_4 column contains all the DS_5 buildings
as well as any buildings likely to be in the DS_4 state.
General applicability
These examples have covered defining functions to use for the Consequence Analysis phase of the model,
i.e. we have been switching out the analysis.function model parameter with our new functions.
However, you can define functions that can be used in any RiskScape expression, which makes the flexibility of RiskScape quite powerful.
For example, you could define functions that you can use in bookmarks (i.e. set-attribute)
to pre-process your data. Expression functions can also call other functions, which lets you
build up more complex data processing chains.
Tip
You can also find open-source RiskScape functions available in the
GitHub RiskScape repository.
These functions can be imported directly into your project.ini file, if applicable.
Recap
Let’s review some of the key points we have covered so far:
RiskScape models use a risk function to determine the impact that the hazard has on each element-at-risk. The function’s return value becomes the
consequencein the model’s results.The risk function gets passed the exposure-layer input data, along with the hazard intensity measure. These values are called the function’s arguments.
There are several different frameworks you can use to define a risk function:
CSV-based functions are good for basic fragility or vulnerability curves, and require no coding.
Coding a risk function in Python is a little bit more complicated, but gives you more flexibility overall.
RiskScape supports two different ‘flavours’ of Python: Jython and CPython. CPython requires a little extra setup, but it supports common Python packages like
numpyandscipy.
Expression functions are a little bit more advanced, but can be handy to do simple things, like the equivalent of a spreadsheet formula.
A set of related attributes (i.e. attributes that come from the same input layer) is called a struct in RiskScape. In a Python function, a struct is simply a Python dictionary.
The hazard function argument is
nullable. If no hazard intensity measure was determined, then your function will be passed ahazardvalue equal toNonein Python.You can optionally define your own struct types in your
project.ini. This can make it easier to define your functions. Alternatively, you can useanythingfor your function’sargument-typesif you’re not sure what type the data is.If there is a coding error in your Python function, then you will get the Python error reported when you try to use the function in a RiskScape model.
Once you feel comfortable with project files, you could go through Recapping the basics.
Extra for experts
If you want to explore functions a little further, you could try the following exercises out on your own.
Try fixing up the
exposed_timber_buildingsfunction (i.e. thefunctions/bad.pyPython code) so that it works with theriskscape model run exposure-by-regioncommand. Note: check the results carefully - it’s possible that there is more than one mistake in the Python code.In the
functions/sub-directory there is abuggy.pyPython file that has a couple of problems with it. Add this function to your project and try using it in theexposure-by-regionmodel. Look at the Python error that theriskscape model runcommand gives you and try to fix it in thebuggy.pyfile. Re-run the command until the model runs successfully.Try adding some debug to
buggy.pyPython function for school buildings. Add the statements below to the Python code and then run the function in theexposure-by-regionmodel again.if building['Use_Cat'] == 'Education': print("Cons_Frame: {} Use_Cat: {} hazard: {}".format( building['Cons_Frame'], building['Use_Cat'], hazard))